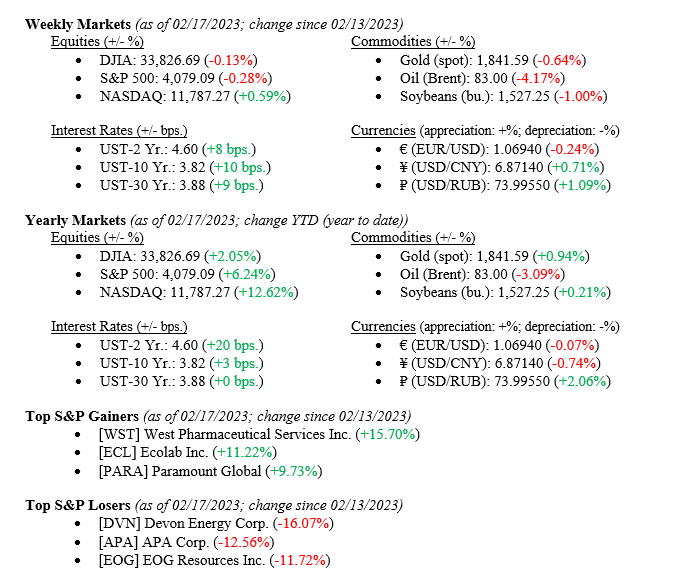
Equity market returns were mixed last week ahead of the President’s Day Holiday weekend, with the NASDAQ posting a modest gain of +0.59%. The S&P 500 Index moved lower by –0.28%, and the Dow Jones Industrial Average lost –0.28%. Mixed signals from the economy continue to foil investors and Wall Street Economists. Last week, we saw continued decreases in inflation indicators as measured by the U.S. Consumer Price Index and the U.S. Core Consumer Price Index. This tells the story the Fed is looking for: a slowing economy and inflation. However, behind that data release, the U.S. Retail Sales report (remember, ~70% of the U.S. Economy is consumer driven) came in higher-than-expected, hinting that the economy is still running at full steam. Overnight, economists moved over to our ongoing thesis here at VNFA, that a recession in 2023 is less likely.
US Economy
As mentioned above, last week showed us that the U.S. Economy continues to hum along nicely, with solid retail sales data proving that the consumer is not backing down and continues spending. Chart 1 below from the Federal Reserve Bank of St. Louis shows U.S. Retail Sales. Advanced Retail Sales (Trade & Services) increased by 3.0% in January 2023 versus a decline the prior month of –1.1%. This unexpected increase in consumer activity shows that not only is the U.S. Consumer remaining resilient, but they are also not concerned very much about the future economy to curtail their spending.
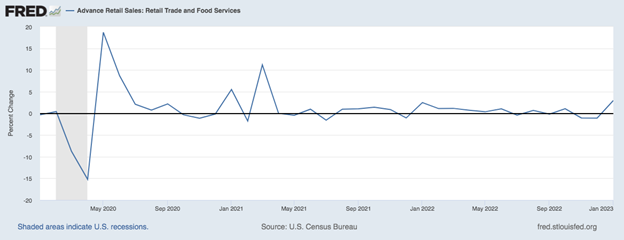
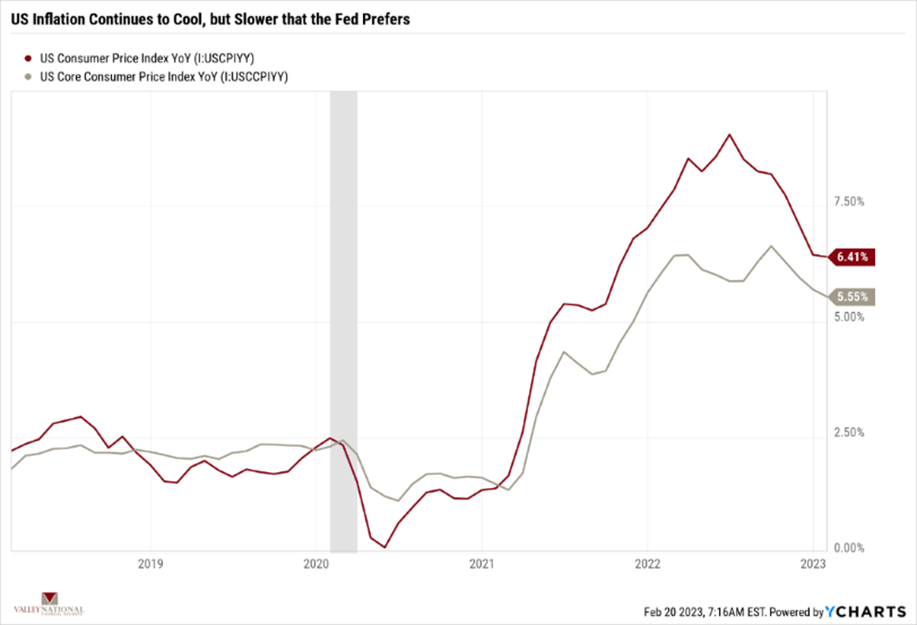
Chart 2 below from Valley National Financial Advisors and Y Charts shows U.S. Consumer Price Index and U.S. Core Consumer Price Index. As can be seen in Chart 2, inflation continues to cool as it had been doing since the 9% peak rate in June 2022. However, the pace of the slowing is what concerns the Fed. Fed Chairman Jay Powell would like to see inflation hit its target rate of 2%, as we all would, but it is taking longer, and more rate hikes will be needed. Futures markets are now pricing in a 50% chance of a June rate hike of +0.25%, which would be on top of +0.25% rate hikes at the March and May 2023 FOMC (Federal Open Market Committee) meetings. While concerning to us that further rate hikes are needed, we also believe that the economy continues to be strong enough to sustain higher interest rates and still grow at a modest pace, and the markets all seem to agree.
Policy and Politics
The Great China “Re-opening” of 2023 gives foreign markets reasons to hope that a pent-up, Covid-lockdown, Chinese consumer is about to unleash their spending on the global economy and fuel a solid rebound in economic activity. The Russia / Ukraine War rages on with neither side capitulating. U.S. President Biden’s surprise visit to Ukraine on February 20 pointed to symbolic support from the U.S., and a $500 million check from the U.S. offered real support. As spring comes into focus, the war could hurt global food supplies (Ukraine) and fertilizer (Russia). Lastly, instability in South America with regional democratic powerhouses such as Argentina always offers us a little worry and uncertainty.
What to Watch
- Tuesday, February 21st
- Existing Home Sales at 10:00 AM (Prior: 4.02M)
- Existing Home Sales MoM (Month Over Month) at 10:00 AM (Prior: -1.47%)
- Retail Gas Price at 4:30 PM (Prior: $3.502/gal.)
- Thursday, February 23rd
- Real GDP (Gross Domestic Product) QoQ at 8:30 AM (Prior: 2.90%)
- Total Vehicle Sales at 10:30 AM (Prior: 16.20M)
- 30 Year Mortgage Rate at 12:00 PM (Prior: 6.32%)
- Friday, February 24th
- Core PCE Price Index YoY at 8:30 AM (Prior: 4.42%)
- PCE Price Index YoY at 8:30 AM (Prior: 5.02%)
- Personal Income MoM at 8:30 AM (Prior: 0.22%)
- Personal Spending MoM at 8:30 AM (Prior: -0.23%)
- Index of Consumer Sentiment at 10:00 AM (Prior: 66.40)
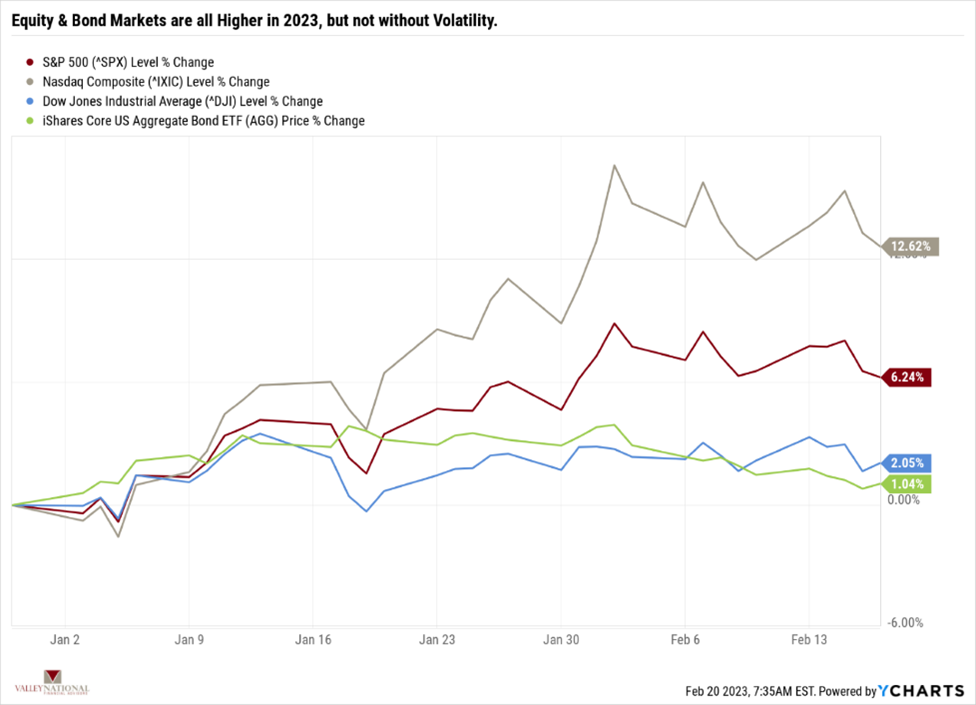
The Federal Reserve and Chairman Powell are on a mission to combat inflation with a target of 2%. Chart 2 above shows the progress the Fed has made thus far. A slowing pace in this regard simply puts more rate hikes on the horizon. Solid labor growth, falling unemployment, increasing consumer activity, and corporate “belt-tightening” show us that the U.S. economy remains healthy and will power through the current rate-hiking cycle. Further, a brief look at the equity and bond markets year-to-date shows that they are living up to their function as wonderful future economic indicators. Chart 3 below from Valley National Financial Advisors shows all three major equity market indicators and the iShares Core U.S. AGG Bond ETF. Year-to-date, each indicator is modestly higher, with the tech-heavy NASDAQ topping them all at +12.6%.