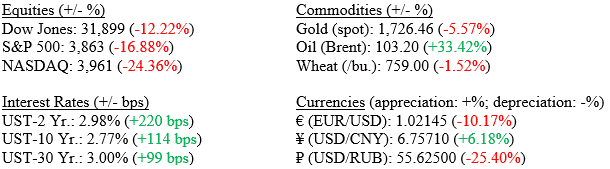
Although the market was dealt some mixed signals on the economy and earnings, overall, we ended resoundingly positive by week’s end and all three major indexes posted strong gains. Preliminary July manufacturing and services sector reports all signaled slowing business activity, notably for the U.S. services sector, conversely, Q2 earnings season kicked into a higher gear and of the 104 S&P 500 companies that have reported, 56% have topped revenue forecasts and approximately 72% have bested profit projections, per data compiled by Bloomberg. Many investors feel the best indicator of future economic growth is the stock market and that gauge helps in projecting a coming recession. Several prognosticators are predicting a recession within the next few quarters. It seems likely that we will have a technical recession (two quarters of negative Gross Domestic Product), but we believe a cyclical recession (one where there is severe employment destruction) is unlikely. We take a deep dive into several recession-related economic indicators below. For the week, the Dow Jones Industrial Average rose +2.0%, the S&P 500 Index +2.6%, and the NASDAQ moved higher by +3.3%. The 10-year U.S. Treasury Bond fell 16 basis points last week to close the week at 2.77%, once again giving investors over 1.00% for the week, and solidly inverting the yield curve.
Markets (as of 7/22/2022; change YTD)
Domestic Economy
Chart 1 below (from the Federal Reserve Bank of St. Louis) shows the 10-2 Treasury yield spread, which is the difference between the 10-Year U.S. Treasury Yield and the 2-Year U.S. Treasury yield. A spread that approaches zero, or in the current market, is negative, (meaning an investor is getting less return for extending their bond’s maturity) has historically been a precursor to a recessionary period. However, the time between an inverted yield curve and a recession ranged from 6 to 24 months afterwards; meaning, this is a far-leading indicator. As noted above, the 10-Year U.S. Treasury fell again last week, hitting 2.77% down significantly from the 3.48% yield it hit in June of this year. It is likely that institutional investors who are still sitting on piles of uninvested cash saw the 10-Year U.S. Treasury yield above 3.00% compared with recent anemic levels well below 1.00% as an attractive investment and that move back into Treasuries has pushed yields lower.
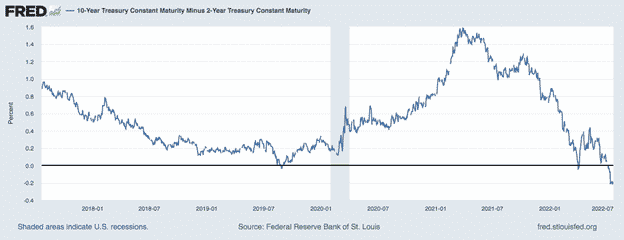
Chart 2 below (from Valley National Financial Advisors and YCharts, recessions shaded) shows the Composite of Leading Indicators by the OECD. The index is published monthly by The Conference Board. It is used to help predict the direction of global economic movements in future months. The index is composed of 10 economic components, such as: employment activity, manufacturing orders, and stock market behavior. Businesses and investors can use the index to help plan their activities around the expected performance of the economy and protect themselves from economic downturns. This indicator turned negative in September of 2021, predicting a recession was looming as every previous recession saw a sharp drop in the Composite of Leading Indicators.
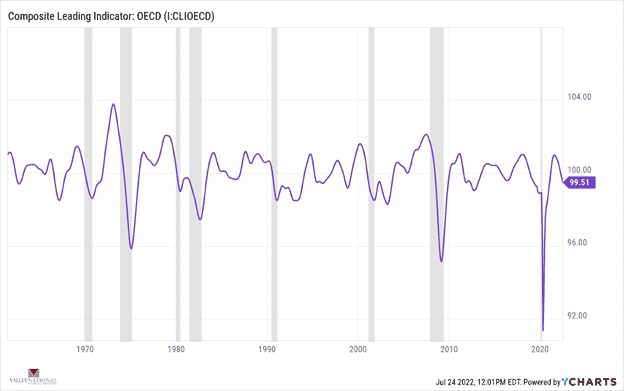
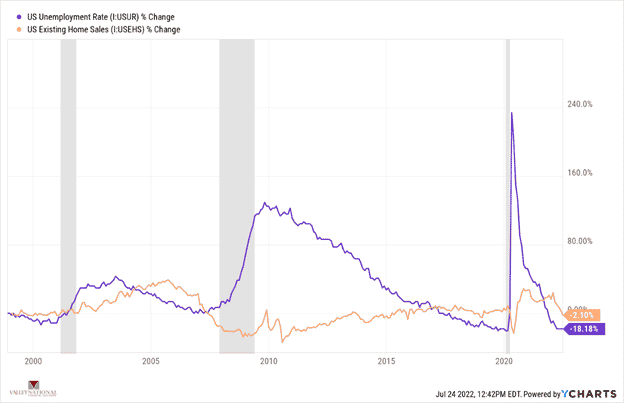
Chart 3 below (from Valley National Financial Advisors and YCharts, recessions shaded) shows U.S. Unemployment rate and U.S. Existing Home Sales charted since 2000. We see how in previous recessions unemployment rose dramatically and home sales slowed. Currently, we have the opposite where unemployment is at an historic low of 3.6% and home sales, while slowing a bit due to recently higher mortgage rates, are still strong. With these two indicators continuing to refute a looming recession we believe a cyclical recession is unlikely in the near term.
Last week we showed how several measures of inflation were starting to come down. Key commodities like copper, lumber, and oil are down from recent highs and manufacturing activity is slowing. Also, gasoline prices, a critical component in everyday spending, is down from recent highs. This data suggests the FED’s path to higher rates is slowing record high inflation and is impacting the super-hot economy. We show above that housing and employment remain strong rebutting calls for a looming recession. We never fail to remind readers how important the consumer is to the U.S. economy – fully 65-75% of economic activity is related to consumer spending and the consumer remains in particularly good financial health; especially when gauged by debt levels, savings accounts and still relatively low (by historic standards) mortgages rates. Pay close attention to the stock market – the true leading indicator of economic activity. The S&P 500 Index is up 5.23% since mid-June 2022, when we continued to see a softening in inflationary data.
Policy and Politics
- The FOMC meets this week and is expected to raise rates 75 – 100 basis points.
- Chairman Powell’s press conference will help us understand future moves
What to Watch
- U.S. New Single-Family House Sold will be released at 10:00AM ET on July 26th.
- Target Federal Funds Rate Upper Limit will be announced at 2:15PM ET on July 27th.
- U.S. Real 2nd Quarter GDP Quarter over Quarter will be released at 8:30am on July 28th.
- U.S. PCE Price Index YoY (the FED’s preferred inflation gauge) released at 8:30am on July 29th.